Whenever a DBA is firefighting a database issue, having a reliable set of SQL troubleshooting scripts is crucial. These scripts serve as part of a DBA’s diagnostic toolkit, helping identify and resolve problems related to performance, blocking, backups, resource contention, and more.
Commonly referred to as Dynamic Management View (DMV) queries, these SQL scripts provide both real-time and historical insights into SQL Server’s performance, resource usage, and potential bottlenecks.
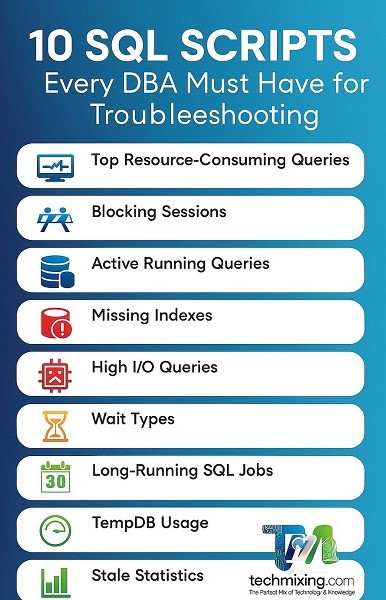
Below is a curated list of 10 essential SQL Server troubleshooting scripts every DBA should keep ready. This article will also describe their purpose, explanation, and practical examples to make performance analysis faster and more effective.

1. Find the Most Expensive Queries (Top Resource Consumers)
This SQL Script is useful when SQL Server is running slow or CPU is high. Below SQL query shows queries consuming the most time/CPU/logical reads. Once the top offenders are identified, as part of next step, we can investigate them using the execution plans.

SELECT TOP 10
    qs.total_elapsed_time / qs.execution_count AS [AvgExecTime],
    qs.execution_count,
    qs.total_logical_reads,
    qs.total_worker_time / qs.execution_count AS [AvgCPUTime],
    SUBSTRING(qt.text, (qs.statement_start_offset/2)+1,
        ((CASE qs.statement_end_offset
          WHEN -1 THEN DATALENGTH(qt.text)
          ELSE qs.statement_end_offset END
          - qs.statement_start_offset)/2)+1) AS query_text
FROM sys.dm_exec_query_stats qs
CROSS APPLY sys.dm_exec_sql_text(qs.sql_handle) qt
ORDER BY [AvgExecTime] DESC;
2. Check Current Blocking Sessions
This SQL Script is useful when users report queries are “hanging.” This query output lists which sessions are blocking others. once the blocking session is identified, we can decide whether to kill it or resolve it.

SELECT
    blocking_session_id AS Blocker,
    session_id AS Blocked,
    wait_type, wait_time, wait_resource,
    DB_NAME(database_id) AS DatabaseName,
    TEXT AS BlockedQuery
FROM sys.dm_exec_requests
CROSS APPLY sys.dm_exec_sql_text(sql_handle)
WHERE blocking_session_id <> 0;
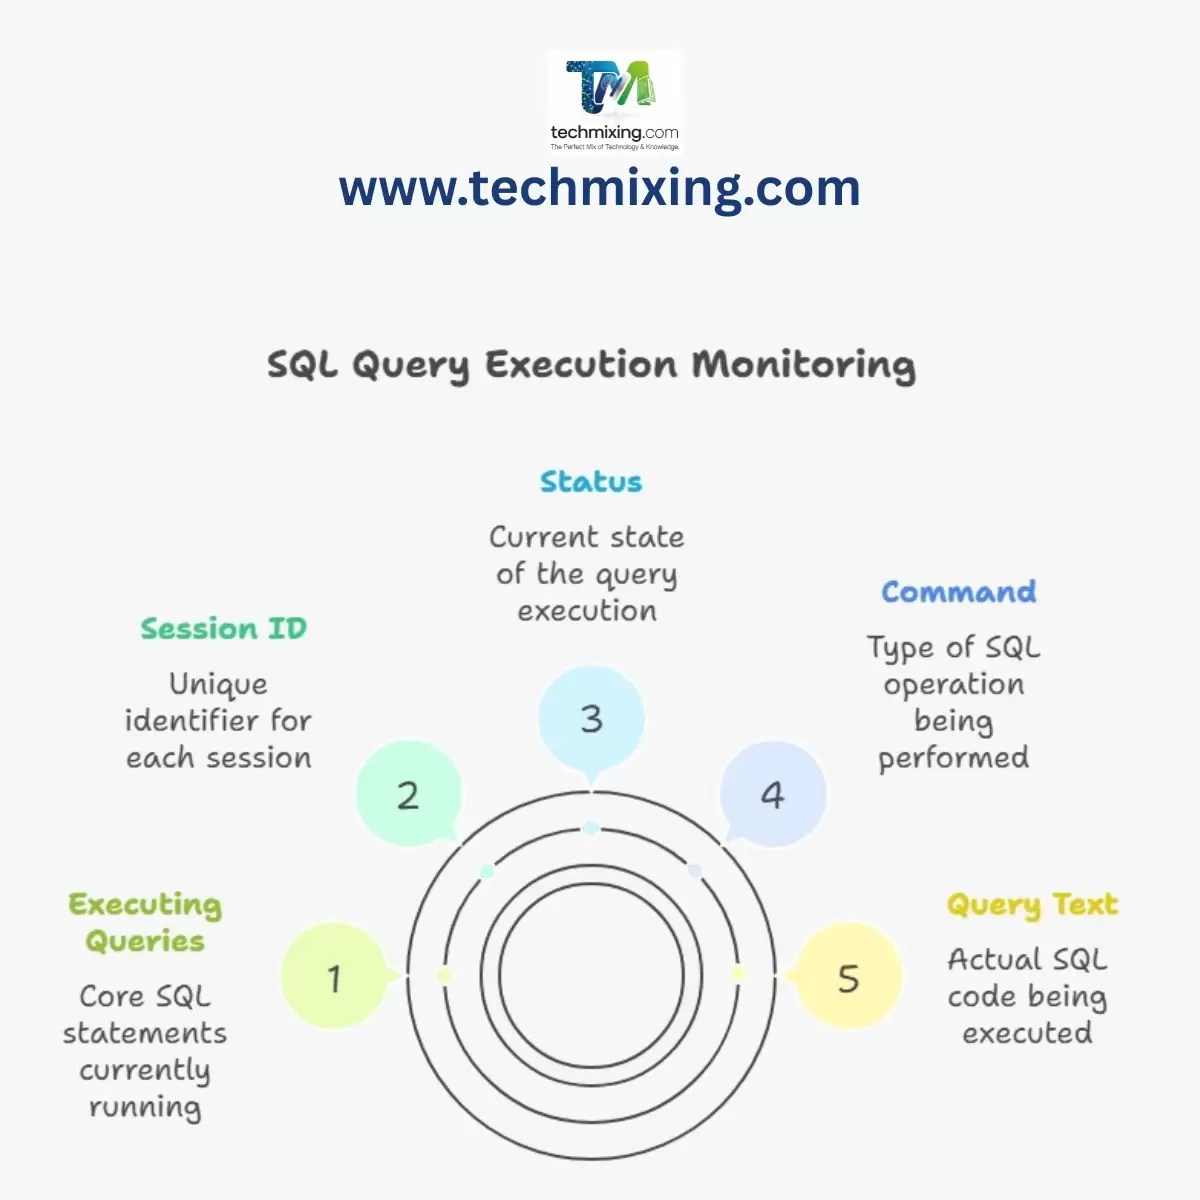
3. Identify Queries Currently Running
This SQL query is useful when we need to know which SQL queries are executing right now. It helps you view live queries and their performance impact.
SELECT
    r.session_id,
    r.status,
    r.command,
    t.text AS QueryText,
    r.cpu_time,
    r.total_elapsed_time,
    DB_NAME(r.database_id) AS DatabaseName
FROM sys.dm_exec_requests r
CROSS APPLY sys.dm_exec_sql_text(r.sql_handle) t
ORDER BY r.total_elapsed_time DESC;
4. Detect Missing Indexes
This SQL query is useful when we notice slow table scans or high I/O reads. This SQL Script Suggests potential indexes we can create to improve performance.

SELECT
    mid.statement AS TableName,
    migs.avg_total_user_cost * migs.avg_user_impact AS ImprovementPotential,
    'CREATE INDEX IX_' + OBJECT_NAME(mid.object_id) + '_' +
    REPLACE(REPLACE(REPLACE(ISNULL(mid.equality_columns,''),', ','_'),'[',''),']','') +
    ' ON ' + mid.statement +
    '(' + ISNULL(mid.equality_columns,'') +
    CASE WHEN mid.inequality_columns IS NULL THEN '' ELSE ',' + mid.inequality_columns END + ')' +
    ISNULL(' INCLUDE (' + mid.included_columns + ')','') AS CreateIndexStatement
FROM sys.dm_db_missing_index_groups mig
JOIN sys.dm_db_missing_index_group_stats migs ON migs.group_handle = mig.index_group_handle
JOIN sys.dm_db_missing_index_details mid ON mig.index_handle = mid.index_handle
ORDER BY ImprovementPotential DESC;
Please Note: Review these suggested indexes before implementing them on the Production Server. DMVs also get reset on restart.
5. Find Queries with High I/O Reads
This SQL script is useful when we suspect I/O bottlenecks. This SQL script Identifies queries that consume the most reads per execution.

SELECT TOP 10
    (total_logical_reads + total_physical_reads) / execution_count AS AvgReads,
    execution_count,
    total_logical_reads,
    total_physical_reads,
    SUBSTRING(qt.text, qs.statement_start_offset/2,
        (CASE WHEN qs.statement_end_offset = -1 THEN LEN(CONVERT(NVARCHAR(MAX), qt.text)) * 2
         ELSE qs.statement_end_offset END - qs.statement_start_offset)/2) AS query_text
FROM sys.dm_exec_query_stats qs
CROSS APPLY sys.dm_exec_sql_text(qs.sql_handle) AS qt
ORDER BY AvgReads DESC;
6. Check CPU Usage by Queries
This SQL script is useful when we notice that SQL Server CPU usage is abnormally high. This SQL Script helps in finding CPU-heavy queries for optimization.

SELECT TOP 10
    total_worker_time/1000 AS TotalCPUms,
    execution_count,
    (total_worker_time/execution_count)/1000 AS AvgCPUms,
    SUBSTRING(qt.text, (qs.statement_start_offset/2)+1,
        ((CASE qs.statement_end_offset
          WHEN -1 THEN DATALENGTH(qt.text)
          ELSE qs.statement_end_offset END
          - qs.statement_start_offset)/2)+1) AS query_text
FROM sys.dm_exec_query_stats qs
CROSS APPLY sys.dm_exec_sql_text(qs.sql_handle) AS qt
ORDER BY AvgCPUms DESC;
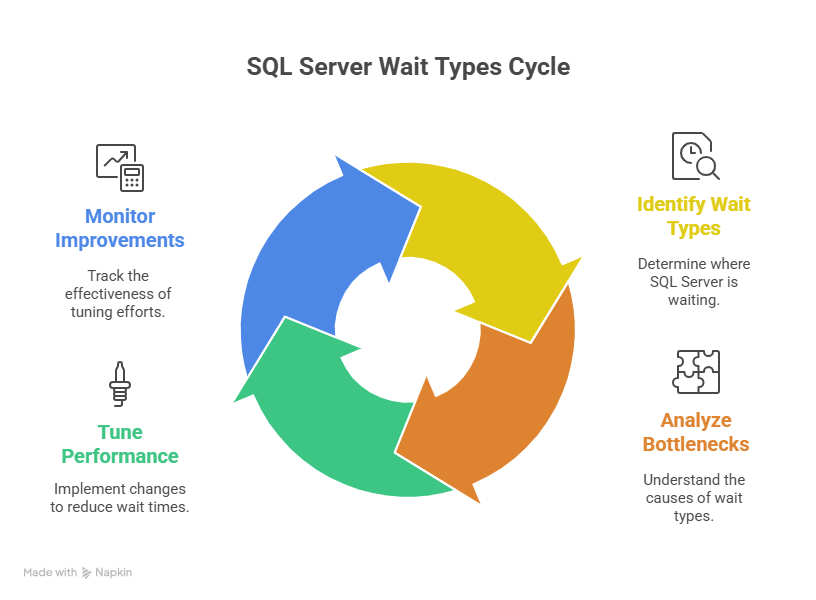
7. Check SQL Server Wait Types
This SQL script is useful when we want to understand where SQL Server is “waiting.” This SQL script reveals bottlenecks — e.g. PAGEIOLATCH (I/O), CXPACKET (parallelism), LCK_ (locks). This is one of the main SQL query which can be use to guide the performance tuning efforts.
SELECT
    wait_type,
    waiting_tasks_count AS WaitCount,
    wait_time_ms / 1000 AS WaitTimeSec,
    (wait_time_ms / waiting_tasks_count) AS AvgWaitMs
FROM sys.dm_os_wait_stats
WHERE wait_type NOT IN (
    'SLEEP_TASK','BROKER_EVENTHANDLER','SQLTRACE_BUFFER_FLUSH','LAZYWRITER_SLEEP',
    'XE_DISPATCHER_WAIT','FT_IFTS_SCHEDULER_IDLE_WAIT','BROKER_TO_FLUSH')
AND waiting_tasks_count>0
ORDER BY WaitTimeSec DESC;
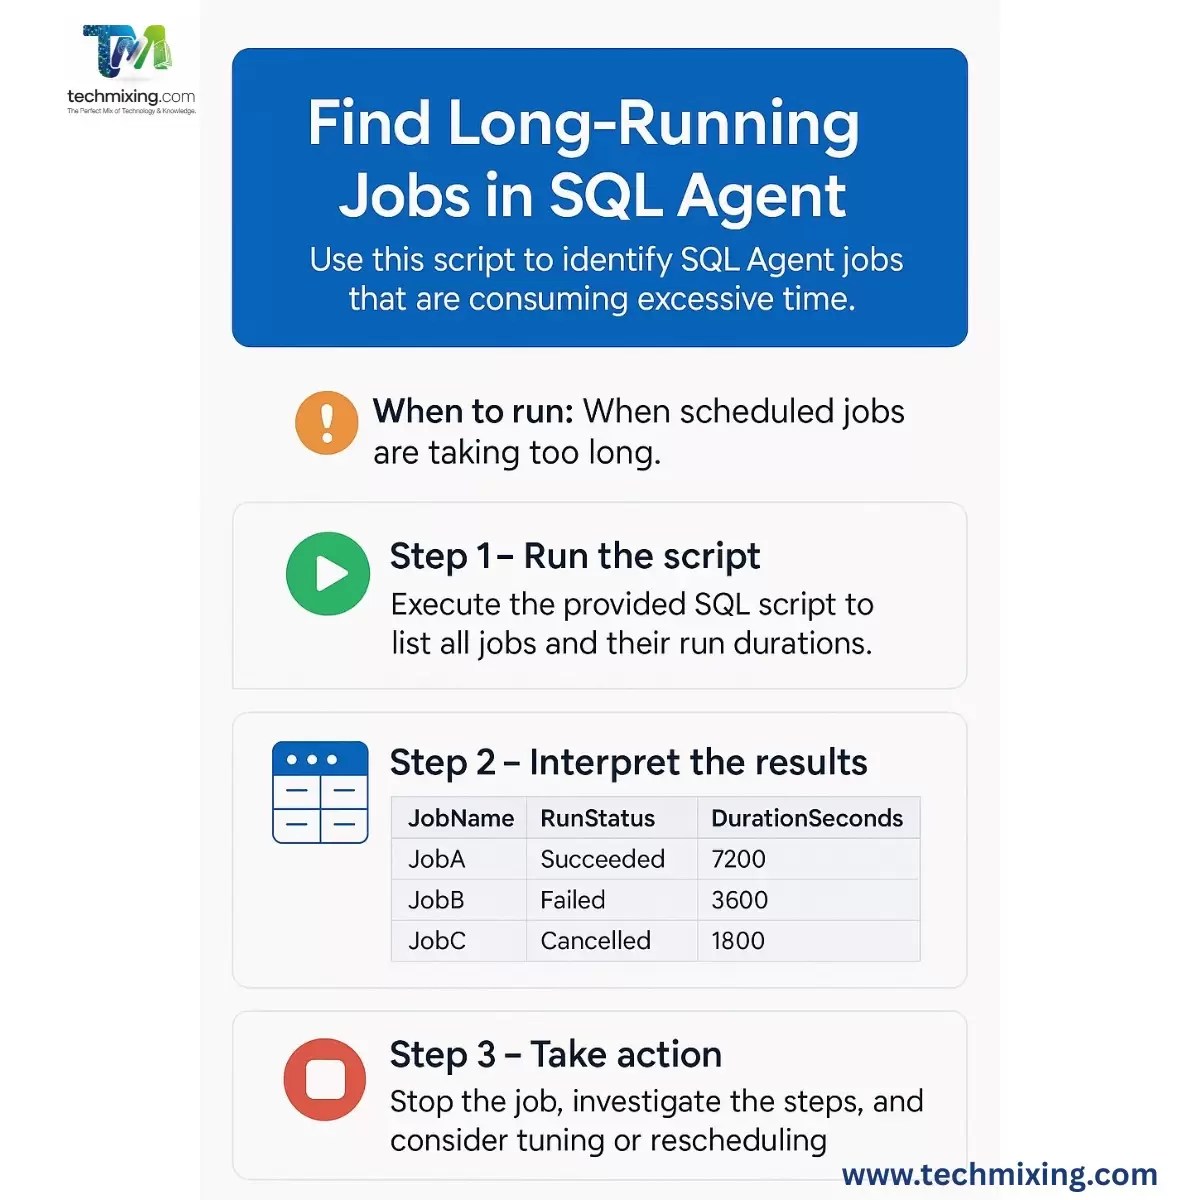
8. Find Long-Running Jobs in SQL Agent
This below SQL script is useful when scheduled jobs are taking too long. This SQL script shows which jobs are consuming excessive time.
SELECT
    sj.name AS JobName,
    run_status = CASE h.run_status
        WHEN 0 THEN 'Failed'
        WHEN 1 THEN 'Succeeded'
        WHEN 2 THEN 'Retry'
        WHEN 3 THEN 'Cancelled'
        ELSE 'Unknown' END,
    msdb.dbo.agent_datetime(run_date, run_time) AS RunDateTime,
    (run_duration/10000*3600 + (run_duration%10000)/100*60 + run_duration%100) AS DurationSeconds
FROM msdb.dbo.sysjobs sj
JOIN msdb.dbo.sysjobhistory h ON sj.job_id = h.job_id
WHERE h.run_date >= CONVERT(INT, CONVERT(VARCHAR, GETDATE(), 112))
ORDER BY DurationSeconds DESC;
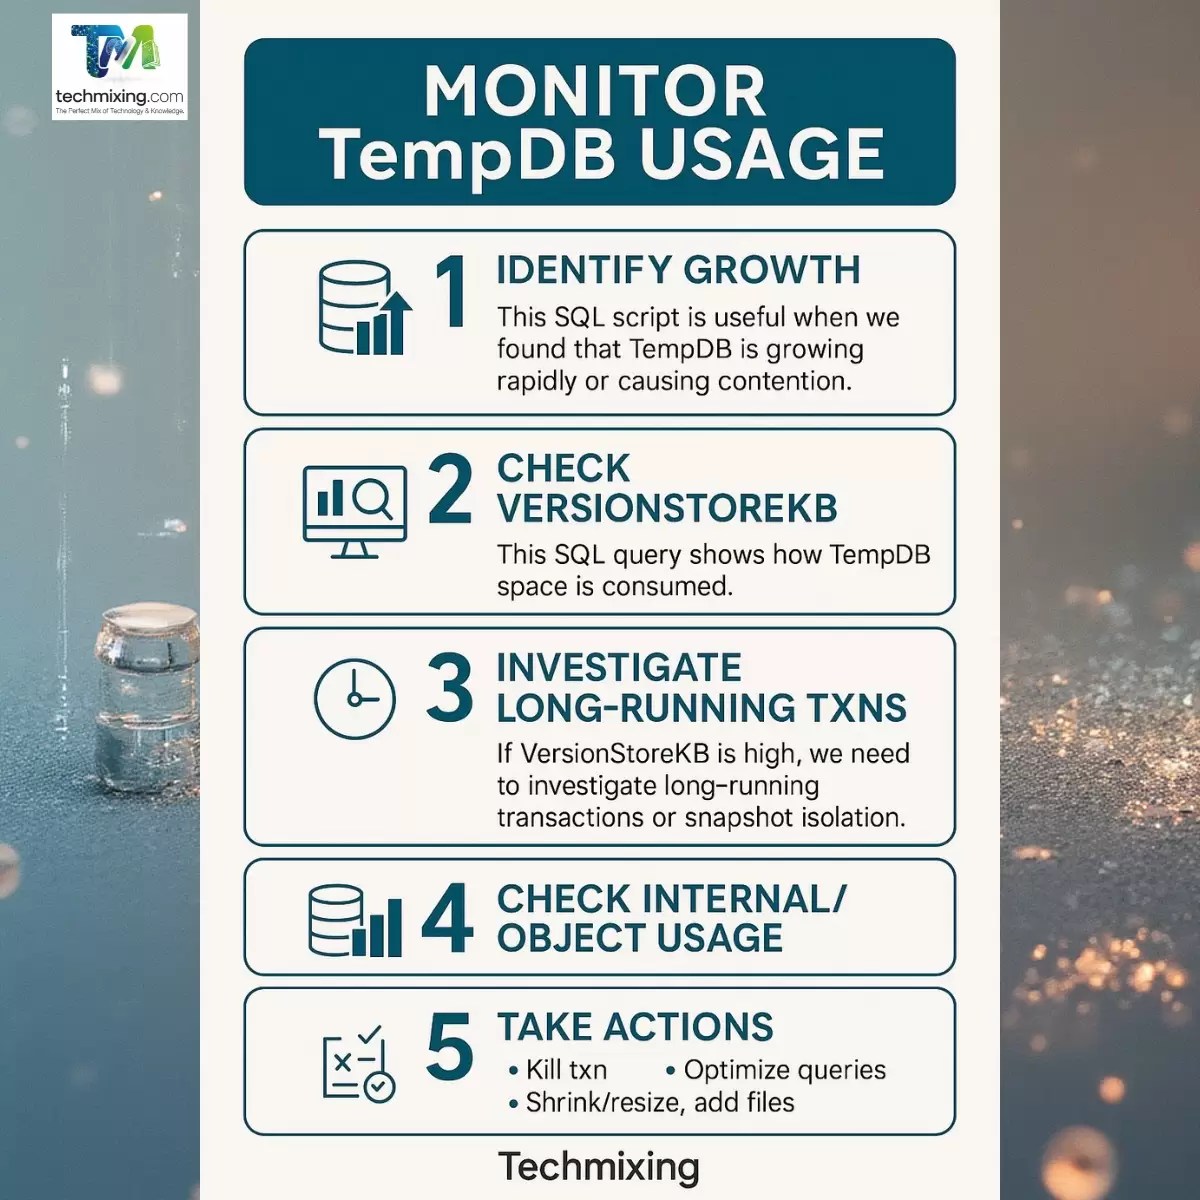
9. Monitor TempDB Usage
This SQL script is useful when we found that TempDB is growing rapidly or causing contention. This SQL query shows how TempDB space is consumed.
If VersionStoreKB is high, we need to investigate long-running transactions or snapshot isolation.
SELECT
    SUM(user_object_reserved_page_count)*8 AS UserObjectsKB,
    SUM(internal_object_reserved_page_count)*8 AS InternalObjectsKB,
    SUM(version_store_reserved_page_count)*8 AS VersionStoreKB,
    SUM(unallocated_extent_page_count)*8 AS FreeSpaceKB
FROM sys.dm_db_file_space_usage;
10. Identify Missing or Stale Statistics.
This SQL Script is useful when Query optimizer isn’t choosing the best plans. This SQL script finds tables where statistics are outdated.

SELECT
    OBJECT_NAME(s.object_id) AS TableName,
    s.name AS StatName,
    STATS_DATE(s.object_id, s.stats_id) AS LastUpdated,
    sp.rows AS Row_Count
FROM sys.stats s
JOIN sys.sysindexes sp ON s.object_id = sp.id
WHERE STATS_DATE(s.object_id, s.stats_id) < DATEADD(day, -7, GETDATE())
ORDER BY LastUpdated;
We should update tables stats regularly. For updating tables statistics, we can use the below SQL query.
EXEC sp_updatestats;
Bonus Script — Monitor SQL Server Memory Usage
This below SQL script checks SQL Server’s current memory footprint.
SELECT
    physical_memory_in_use_kb/1024 AS SQLMemoryMB,
    locked_page_allocations_kb/1024 AS LockedPagesMB,
    total_virtual_address_space_kb/1024 AS TotalVASMB,
    process_physical_memory_low,
    process_virtual_memory_low
FROM sys.dm_os_process_memory;
Summary — The DBA’s Essential Troubleshooting Kit
| # | Script Name | Purpose |
|---|---|---|
| 1 | Top Resource-Consuming Queries | Identify heavy queries |
| 2 | Blocking Sessions | Diagnose locks and blocking |
| 3 | Active Running Queries | See live performance impact |
| 4 | Missing Indexes | Suggest performance improvements |
| 5 | High I/O Queries | Detect I/O bottlenecks |
| 6 | High CPU Queries | Identify CPU-intensive workloads |
| 7 | Wait Types | Find systemic bottlenecks |
| 8 | Long-Running Jobs | Monitor job performance |
| 9 | TempDB Usage | Manage TempDB growth |
| 10 | Stale Statistics | Maintain optimizer accuracy |
Closing Thoughts
Every skilled DBA has a diagnostic toolbelt of go-to scripts.
These above mentioned 10 SQL scripts form your first line of defense. It helps you troubleshooting performance issues before they become outages.
Tip: Save these scripts as a custom DBA Toolkit in SSMS, or schedule them as SQL Agent jobs to monitor your server automatically.
To learn more about SQL Server wait types and how they can help in performance tuning, read this article.
To learn more about SQL Server DMVs, read this article.
Read more articles on Performance tuning, click here
Read more articles on SQL Server, click here
Enjoyed this post? Support the blog by liking, sharing, and subscribing for more articles on Data, AI & Cloud.
Discover more from Technology with Vivek Johari
Subscribe to get the latest posts sent to your email.

