Introduction
If the SQL Server instance is slow, the most valuable diagnostic tool is often the simplest: checking Wait Types. Wait Types tell us exactly what resources SQL Server is waiting for before it can complete a query, acting as the ultimate root-cause analysis for performance bottlenecks
They are like SQL Server’s internal health indicators, helping DBAs identify where the engine is spending time – on I/O, locks, memory, or CPU.
Mastering the top 10 Wait Types is the fastest way for DBAs and developers to move from guessing games to precise performance tuning.
In this article, you’ll learn about the Top 10 SQL Server Wait Types, what they mean, and practical ways to resolve them.
What Are Wait Types?
When a SQL query executes, it occasionally pauses because a necessary resource—like CPU time, a memory page, or a lock—is unavailable. This pause is recorded as a “wait.” A Wait Type is a category that defines the resource the task is waiting for.
You can view this data using the Dynamic Management View (DMV):

SELECT wait_type, waiting_tasks_count, wait_time_ms, signal_wait_time_ms
FROM sys.dm_os_wait_stats
ORDER BY wait_time_ms DESC;
By analyzing the output, you can quickly spot which waits are dominating system performance.
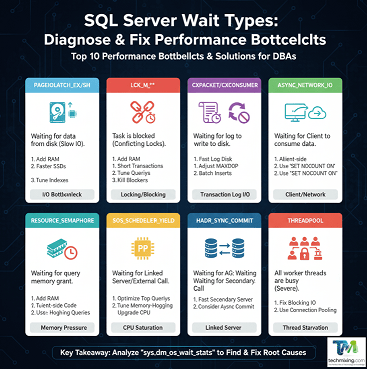
Top 10 SQL Server Wait Types and Their Fixes
1. PAGEIOLATCH_EX / PAGEIOLATCH_SH
This wait type indicates a task is waiting for a data page to be read from disk into the Buffer Pool (SQL Server’s memory cache). The EX (Exclusive) wait is for pages being modified, and SH (Shared) is for pages being read.
Category: I/O Bottleneck (I/O)
| Root Cause | Fixes (Actionable Steps) |
| Slow I/O Subsystem | Upgrade Storage: Move data and log files to faster disks (SSDs, NVMe). |
| Insufficient Memory | Increase RAM: Add more physical memory to expand the Buffer Pool, allowing more data to be cached and reducing disk reads. |
| Poor Indexing | Tune Indexes: Create indexes to allow queries to retrieve fewer data pages (lower Logical I/O). |
2. LCK_M_**
These waits mean one process is blocked because another transaction already holds a conflicting lock on a resource (a row, page, or table). This is the quintessential blocking issue.
Category : Locking and Blocking (Locks)
| Root Cause | Fixes (Actionable Steps) |
| Long Transactions | Shorten Transactions: Keep user transactions as brief as possible, committing or rolling back quickly. |
| Full Table/Page Scans | Tune Queries: Ensure every query uses the most selective indexes to minimize the scope of locks. |
| Head Blocker | Kill Blockers: Use sp_whoisactive to identify the blocking Session ID (SPID) and investigate/terminate the problematic query. |
3. WRITELOG
In this Wait type, server is waiting for the transaction log record to be physically written (hardened) to the disk. Since log writes are synchronous and critical for transaction durability, slow log I/O severely limits transaction throughput.
Category : Transaction Log I/O
| Root Cause | Fixes (Actionable Steps) |
| Slow Log Disk | Isolate Log Files: Place the transaction log files on a dedicated, lightning-fast disk subsystem (separate from the data files). |
| VLF Fragmentation | Manage VLF: Control log file growth increments to maintain an optimal number of Virtual Log Files (VLFs), improving sequential write performance. |
| Transaction Spam | Batch Inserts: Combine many small transactions into fewer, larger transactions where application logic allows. |
4. CXPACKET / CXCONSUMER
This Wait types are related to parallel query execution. CXPACKET occurs when parallel threads wait for each other to finish a step (synchronization). CXCONSUMER occurs when a thread must wait for another thread to produce data. They signal inefficient parallelism.
Category : Parallelism Issues (CPU / Parallelism)
| Root Cause | Fixes (Actionable Steps) |
| Excessive Parallelism | MAXDOP Setting: Set the server-level Max Degree of Parallelism (MAXDOP) to a reasonable value (e.g., number of physical cores or half the logical cores, up to 8). |
| CTFP Too Low | Increase CTFP: Raise the Cost Threshold for Parallelism (CTFP) (default is 5) to prevent quick queries from wasting time splitting into parallel tasks. |
| Skewed Data | Rebuild Stats: Ensure statistics are up-to-date and accurate, as skewed data leads to poor parallel plan choices. |
5. ASYNC_NETWORK_IO
In this Wait Type, database has finished executing the query and compiling the result set, but it is waiting for the client application to finish consuming and acknowledging the data over the network. This often indicates a client-side problem.
Category : Client/Network Bottleneck (Network)
| Root Cause | Fixes (Actionable Steps) |
| Slow Client Processing | Client-Side Code: Ensure the application uses asynchronous data streaming or data pagination instead of loading massive result sets all at once. |
| Excessive Data | Reduce Payload: Only select the columns and rows absolutely necessary. |
| Protocol Overhead | Use SET NOCOUNT ON: This prevents SQL Server from sending row count messages back to the client after DML statements, slightly reducing network traffic. |
6. RESOURCE_SEMAPHORE
In this wait Type, queries requiring a memory grant (typically for operations like large sorts, hash joins, or building hashes for aggregation) are waiting for available execution memory. This is a direct sign of insufficient or poorly allocated RAM for query execution.
Category : Query Memory Pressure (Memory)
| Root Cause | Fixes (Actionable Steps) |
| Insufficient RAM | Add Physical Memory: Increase the total RAM available to the SQL Server instance. |
| Inefficient Queries | Query Tuning: Create indexes to enable seek operations and eliminate large sorts/hashes, drastically reducing memory needs. |
| Max Server Memory | Check Limits: Ensure the max server memory setting is configured correctly, leaving adequate memory for the OS. |
7. SOS_SCHEDULER_YIELD
This Wait type indicates a task is waiting for its time slice on the CPU to be renewed. This means a task has used its allocated CPU time and has voluntarily yielded the CPU to allow other tasks to run. While yielding is normal, its high aggregate count indicates the server is under heavy CPU load and is likely CPU-bound.
Category : CPU Saturation (CPU Scheduling)
| Root Cause | Fixes (Actionable Steps) |
| CPU Overload | Identify Top Consumers: Use sys.dm_exec_query_stats to find and optimize the top most CPU-intensive queries. |
| Under-Powered CPU | Upgrade Hardware: Scale up the CPU (add cores or faster processors). |
| Busy Loops | Check Application Logic: Look for application loops that generate excessively high numbers of brief queries. |
8. OLEDB
Tasks are waiting for an OLE DB provider, typically used when querying a linked server or when SQL Server is performing internal asynchronous operations. The wait time is spent waiting for the external resource to respond.
Category : Linked Server / External Wait
| Root Cause | Fixes (Actionable Steps) |
| Slow Remote Server | Isolate Bottleneck: Diagnose the remote linked server instance; the bottleneck is usually there. |
| Inefficient Linking | Use OPENQUERY: Use the OPENQUERY function to execute the query entirely on the linked server, returning only the final result set to the local server. |
| Network Issues | Check Connectivity: Verify low latency and high bandwidth to the linked server location. |
9. HADR_SYNC_COMMIT
This wait type is specific to Always On Availability Groups configured for Synchronous Commit. In this wait type, transaction is waiting for confirmation that the log record has been hardened (written to disk) on all synchronized secondary replicas.
Category : Always On Synchronous Commit
| Root Cause | Fixes (Actionable Steps) |
| Secondary Log Disk Slow | Optimize Secondary I/O: Ensure the transaction log disk for all synchronous replicas is as fast as the primary’s. |
| High Network Latency | Improve Inter-site Link: If replicas are geographically separated, high latency will directly impact this wait. |
| Configuration Trade-off | Consider Async: If strict zero-data-loss isn’t required for a secondary, switching it to Asynchronous Commit will eliminate this wait type. |
10. THREADPOOL
This critical, rare wait means all available worker threads are busy, and a new request must wait for a thread to become free. It is a sign of severe, chronic overload.
Category : Worker Thread Starvation (Connection / Worker Threads)
| Root Cause | Fixes (Actionable Steps) |
| Excessive Blocking/Deadlocks | Fix LCK Waits First: Eliminate root causes of prolonged thread usage (blocking queries, long transactions). |
| Too Many Connections | Application Connection Pooling: Use connection pooling correctly to reuse threads and reduce the number of concurrent physical connections. |
| Max Worker Threads Too Low | Increase Threads: Only as a last resort, increase the max worker threads setting, but be wary of increasing memory consumption. |
How to Analyze Wait Statistics
After collecting wait data, clear the stats and re-measure during peak load to isolate problems.
-- Reset wait stats
DBCC SQLPERF('sys.dm_os_wait_stats', CLEAR);

-- Capture again after workload
SELECT TOP 10 wait_type, wait_time_ms, signal_wait_time_ms
FROM sys.dm_os_wait_stats
ORDER BY wait_time_ms DESC;
Then correlate waits with query workloads using Query Store or sys.dm_exec_requests to find exact offenders.
Steps to fix the SQL Performance Issues using Wait Types
To start fixing performance issues using Wait Types, follow this cycle:

- Collect Data: Run a query against
sys.dm_os_wait_stats(and reset the statistics regularly) to get the most accurate current data. - Identify Top 3: Determine the top 3 Wait Types by aggregate Wait Time (ignoring benign waits like
WAITFORorSLEEP). - Implement Fix: Apply the corresponding solution from the table above.
- Re-measure: Re-collect the wait statistics to confirm that the offending wait type has decreased and that no new, worse wait types have emerged.
Real-World Example
A production SQL Server showed high CXPACKET and SOS_SCHEDULER_YIELD waits.
After analysis we do the below changes:
- We changed the MAXDOP to 4 . Previously it was set to default 0.
- We increased cost threshold for parallelism from 5 to 50.
- We also update the stale statistics.
Result: Query runtime dropped from 44 seconds to 9 seconds, and CPU usage decreased by 40%.
Best Practices to Minimize Waits
- Keep statistics and indexes up to date.
- Monitor wait stats regularly.
- Review execution plans for frequent queries.
- Avoid scalar functions in large queries.
- Separate data/log/tempdb files on dedicated drives.
- Configure tempdb with multiple files (1 per core up to 8).
Conclusion
Understanding SQL Server Wait Types is one of the most effective ways to troubleshoot performance.
By identifying where the bottlenecks occur — CPU, I/O, memory, or locking — you can apply precise fixes rather than guessing.
🔹 Keep monitoring.
🔹 Keep tuning.
🔹 Let SQL Server’s waits guide your optimization path.
To learn more about SQL Server wait types and how they can help in performance tuning, read this article.
To learn more about SQL Server DMVs, read this article.
Read more articles on Performance tuning, click here
Read more articles on SQL Server, click here
Enjoyed this post? Support the blog by liking, sharing, and subscribing for more articles on Data, AI & Cloud.
Discover more from Technology with Vivek Johari
Subscribe to get the latest posts sent to your email.

