
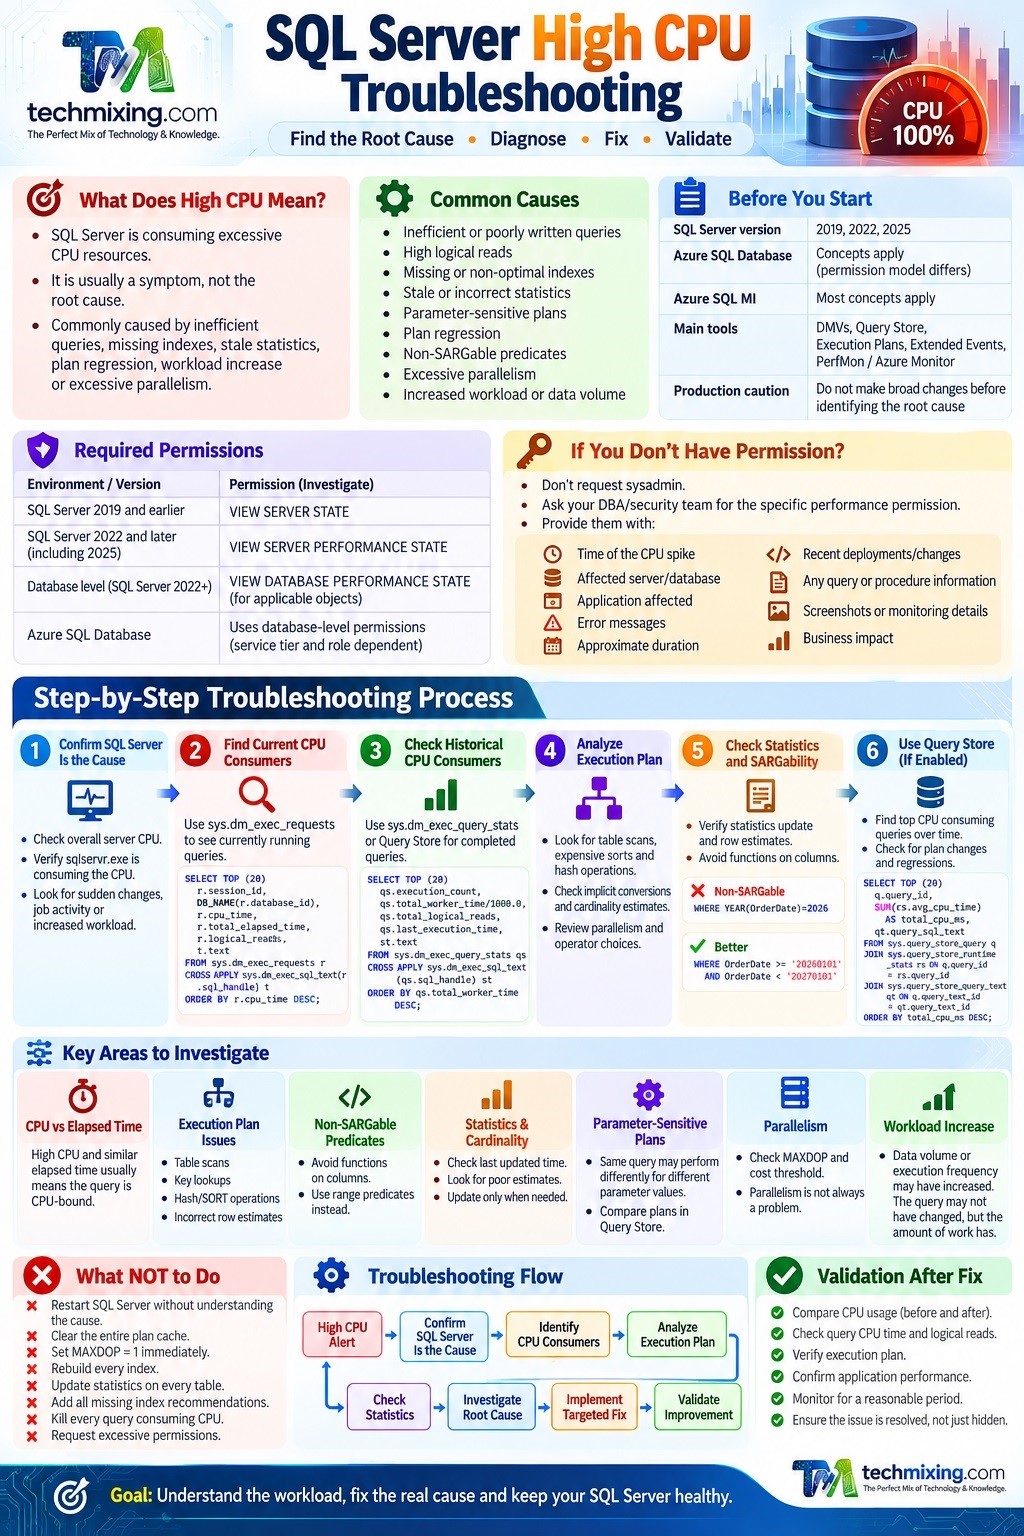
Introduction
Why I wrote this article
When I transitioned from a Database Lead role into a DBA role, I remember getting calls from the customer support team at 2:00 or 3:00 AM saying:

“SQL Server CPU utilization is very high. Can you please check?”
At that time, getting a senior DBA or someone experienced on the phone wasn’t always easy. I often had to investigate the problem myself, search through documentation and Google, understand what was happening, and then decide what to check next.
Those first investigations could take a lot of time especially when you’re dealing with a production system in the middle of the night.
Today, we have AI tools that can help us explore technical problems much faster. But even with AI, you still need to understand what to check, which information to collect, what permissions are required, and when it is safe to take action.
That’s the reason I created this article.
This is not intended to replace an experienced DBA or a proper production troubleshooting process. Instead, it is designed as a quick practical reference for DBAs, developers, and technical support teams when they encounter a SQL Server high CPU issue.
If you’re a new DBA or a support/development professional facing a high CPU alert at 2 AM, I hope this guide saves you some of the time I used to spend searching for answers.
High CPU Utilization issue
A SQL Server server suddenly showing 90–100% CPU utilization is one of the most common production incidents faced by DBAs and technical support teams.
Our natural reaction is often:
“SQL Server needs more CPU.”
But high CPU is usually a symptom, not the root cause.
An inefficient query, excessive logical reads, a plan regression, stale statistics, parameter-sensitive behavior, non-SARGable predicates, excessive parallelism, or simply a significant increase in workload can all contribute to high CPU consumption. Microsoft also identifies inefficient queries, high logical reads, missing indexes, outdated statistics, parameter-sensitive plans and increased workload as common causes. (Microsoft Learn)
The important question is therefore not:
Why is CPU at 100%?
It is:
What work is consuming the CPU, why has that work become expensive, and what changed?
This article provides a practical production troubleshooting approach.
Before You Start
Before running any troubleshooting script, check these details.
| Item | Details |
|---|---|
| SQL Server | SQL Server 2019, 2022 and later |
| SQL Server 2025 | The newer granular performance permissions apply |
| Azure SQL Database | Many concepts apply, but DMV visibility and permissions differ |
| Azure SQL Managed Instance | Most server-level troubleshooting concepts apply |
| Main tools | DMVs, Query Store, execution plans, Extended Events, Performance Monitor/Azure Monitor |
| Production caution | Avoid making configuration or indexing changes before identifying the root cause |
Required permissions
This is an important part of production troubleshooting that is often missing from technical articles.
For SQL Server 2019 and earlier, many server-level performance DMVs require:
VIEW SERVER STATEFor SQL Server 2022 and later, Microsoft introduced more granular performance permissions. Many server-level performance DMVs, including sys.dm_exec_requests and sys.dm_exec_query_stats, require:
VIEW SERVER PERFORMANCE STATESQL Server 2022 and later also use database-level:
VIEW DATABASE PERFORMANCE STATEfor applicable database-scoped performance objects. (Microsoft Learn)
This also applies to SQL Server 2025, which follows the newer permission model.
For Azure SQL Database, permissions are different because there is no traditional instance-level VIEW SERVER STATE permission available to users. For example, sys.dm_exec_query_stats uses database-level permissions depending on the service tier, or the appropriate server role/account. (Microsoft Learn)
What if you don’t have the permission?
Don’t simply request sysadmin.
Ask your DBA or SQL Server security administrator for the specific performance permission required for the investigation.
If you are part of an application or support team and don’t have access, provide the DBA with:
- Time of the CPU spike
- Affected server/database
- Application or service affected
- Error messages
- Approximate duration
- Recent deployments or changes
- Any query or procedure information available
The goal should be least privilege, not giving every support user unrestricted access.
Also remember that the permission needed to investigate a problem may be different from the permission needed to apply the fix.
For example, identifying a missing index does not mean the person investigating the issue should automatically have permission to create that index in production.
Step 1: Confirm That SQL Server Is Actually Causing the CPU Problem
Before running DMVs or analyzing execution plans, start outside SQL Server.
Check:
- Is CPU consistently high or just a short spike?
- Is
sqlservr.execonsuming the CPU? - Is another process responsible?
- Did a deployment, scheduled job, or workload change occur?
Don’t assume:
High server CPU = SQL Server problem
A real-world example
I once worked with a large client where we received a call almost every day around 2:30 AM: CPU reached nearly 100%, the application became inaccessible, and SQL Server Agent jobs started failing.
Our initial SQL Server investigation found nothing unusual. There was no new deployment and no obvious query causing the spike.
After several days, I asked the client to provide a list of all processes running around 2:30 AM.
We discovered that an antivirus scan had been scheduled at that exact time. It heavily consumed CPU for about an hour.
The solution was simple: reschedule the antivirus scan.
The SQL Server issues disappeared.
Lesson: Before troubleshooting SQL Server, first confirm what is actually consuming the server’s CPU. An external process can sometimes look like a SQL Server problem.
Microsoft also recommends first determining whether SQL Server is actually responsible for the CPU pressure before moving deeper into SQL Server troubleshooting.
Step 2: Find What SQL Server Is Doing Right Now
If the CPU problem is happening right now, start with sys.dm_exec_requests.
SELECT TOP (20)
    r.session_id,
    DB_NAME(r.database_id) AS database_name,
    r.status,
    r.command,
    r.cpu_time AS cpu_ms,
    r.total_elapsed_time AS elapsed_ms,
    r.logical_reads,
    r.reads,
    r.writes,
    r.wait_type,
    r.wait_time,
    r.dop,
    SUBSTRING
    (
        t.text,
        (r.statement_start_offset / 2) + 1,
        (
            (
                CASE r.statement_end_offset
                    WHEN -1 THEN DATALENGTH(t.text)
                    ELSE r.statement_end_offset
                END
                - r.statement_start_offset
            ) / 2
        ) + 1
    ) AS statement_text
FROM sys.dm_exec_requests AS r
CROSS APPLY sys.dm_exec_sql_text(r.sql_handle) AS t
WHERE r.session_id <> @@SPID
ORDER BY r.cpu_time DESC;
sys.dm_exec_requests shows information about requests that are currently executing. On SQL Server 2022 and later, viewing server-level request information requires VIEW SERVER PERFORMANCE STATE; on earlier versions, VIEW SERVER STATE is used. (Microsoft Learn)
What should you look for?
Pay particular attention to:
CPU time
Which request is consuming the most CPU?
Logical reads
Is the query processing an unexpectedly large number of pages?
Elapsed time
Is the query actually CPU-bound, or is it spending most of its time waiting?
Wait type
Is the request waiting on another resource?
DOP
Is the query executing in parallel?
Step 3: Compare CPU Time With Elapsed Time
This is one of the simplest but most useful checks.
Suppose you find:
| Query | CPU | Elapsed |
|---|---|---|
| Query A | 9,500 ms | 10,000 ms |
| Query B | 800 ms | 10,000 ms |
Query A is much more CPU-intensive.
Query B is slow, but most of its elapsed time is not CPU time.
A useful approximation is:
Elapsed time − CPU time ≈ time not spent actively consuming CPU
This isn’t a complete wait analysis, but it helps establish whether you’re actually dealing with a CPU-heavy query.
Therefore:
A slow query is not automatically a CPU problem.
Step 4: Find Historical CPU Consumers
What if the CPU spike happened 30 minutes ago and the offending query has already completed?
Use sys.dm_exec_query_stats.
SELECT TOP (20)
    qs.execution_count,
    qs.total_worker_time / 1000.0 AS total_cpu_ms,
    qs.total_worker_time /
        NULLIF(qs.execution_count, 0) / 1000.0 AS avg_cpu_ms,
    qs.total_elapsed_time / 1000.0 AS total_elapsed_ms,
    qs.total_logical_reads,
    qs.last_execution_time,
    DB_NAME(st.dbid) AS database_name,
    st.text AS sql_text
FROM sys.dm_exec_query_stats AS qs
CROSS APPLY sys.dm_exec_sql_text(qs.sql_handle) AS st
ORDER BY qs.total_worker_time DESC;
total_worker_time represents cumulative CPU time for completed executions represented in the cached plan statistics. The statistics are updated when a query completes, and the data is associated with cached plans. (Microsoft Learn)
This means it is useful, but it isn’t a permanent historical repository.
For example, if the plan leaves the cache, those statistics may no longer be available.
That is one reason Query Store is so valuable for production investigations.
Step 5: Check Query Store
If Query Store is enabled, use it to investigate historical CPU consumption and plan changes.
Query Store can retain query text, execution plans and runtime statistics, making it particularly useful when the problematic query has already completed. Query Store runtime statistics can be used to analyze CPU and other execution metrics over time. (Microsoft Learn)
A simple example:
SELECT TOP (20)
    q.query_id,
    p.plan_id,
    SUM(rs.count_executions) AS execution_count,
    SUM(rs.avg_cpu_time * rs.count_executions) / 1000.0
        AS total_cpu_ms,
    SUM(rs.avg_cpu_time * rs.count_executions)
        / NULLIF(SUM(rs.count_executions), 0) / 1000.0
        AS weighted_avg_cpu_ms,
    MAX(rs.last_execution_time) AS last_execution_time,
    qt.query_sql_text
FROM sys.query_store_query_text AS qt
JOIN sys.query_store_query AS q
    ON qt.query_text_id = q.query_text_id
JOIN sys.query_store_plan AS p
    ON q.query_id = p.query_id
JOIN sys.query_store_runtime_stats AS rs
    ON p.plan_id = rs.plan_id
JOIN sys.query_store_runtime_stats_interval AS rsi
    ON rs.runtime_stats_interval_id =
       rsi.runtime_stats_interval_id
WHERE rsi.start_time >= DATEADD(HOUR, -24, GETUTCDATE())
GROUP BY
    q.query_id,
    p.plan_id,
    qt.query_sql_text
ORDER BY total_cpu_ms DESC;
For SQL Server 2019 and earlier, Query Store catalog/runtime objects generally use VIEW DATABASE STATE. SQL Server 2022 and later use the more granular VIEW DATABASE PERFORMANCE STATE permission for applicable Query Store objects. (Microsoft Learn)
Total CPU versus average CPU
Don’t look only at average CPU.
Consider:
Query A
CPU/execution = 5 seconds
Executions    = 10

Total CPU     = 50 seconds
versus:
Query B
CPU/execution = 50 milliseconds
Executions    = 100,000

Total CPU     = 5,000 seconds
Query B may be a much bigger contributor to overall CPU.
This is why execution frequency matters.
Step 6: Investigate the Execution Plan
Once you identify the CPU-intensive query, inspect its execution plan.
Look for:
- Table scans
- Large index scans
- Excessive Key Lookups
- Expensive Sort operations
- Hash operations processing large inputs
- Implicit conversions
- Incorrect cardinality estimates
- Excessive logical reads
- Parallel execution
- Unexpected plan changes
- Large differences between estimated and actual rows
For example:
Large Scan
    ↓
Filter
    ↓
Sort
    ↓
Hash Match
    ↓
Large result
may indicate that SQL Server is doing considerably more work than necessary.
But don’t make the mistake of looking at an execution plan and saying:
“This operator has 70% cost, therefore it is causing 70% of the CPU.”
Estimated operator cost percentages are optimizer estimates used for plan costing. They aren’t a direct measurement of actual CPU consumption.
Step 7: Look for Non-SARGable Predicates
Consider:
SELECT
    CustomerID,
    OrderDate,
    TotalAmount
FROM dbo.Orders
WHERE YEAR(OrderDate) = 2026;
The function is applied to the column.
A range predicate is often more suitable:
SELECT
    CustomerID,
    OrderDate,
    TotalAmount
FROM dbo.Orders
WHERE OrderDate >= '20260101'
  AND OrderDate <  '20270101';
The exact improvement depends on the data, indexes and execution plan, so don’t assume that rewriting a predicate automatically solves the CPU problem.
The important point is:
Make SQL Server do the least amount of unnecessary work possible.
Microsoft specifically lists SARGability problems among the areas to investigate when troubleshooting high CPU. (Microsoft Learn)
Step 8: Check Statistics and Cardinality Estimates
Suppose SQL Server estimates:
Estimated rows: 100
Actual rows:    5,000,000
That is a significant estimation problem.
Poor cardinality estimates can lead the optimizer to select an inefficient execution strategy.
Check the statistics associated with the affected table:
SELECT
    s.name AS statistics_name,
    STATS_DATE(s.object_id, s.stats_id) AS last_updated
FROM sys.stats AS s
WHERE s.object_id = OBJECT_ID('dbo.Orders');
You can inspect a particular statistic with:
DBCC SHOW_STATISTICS
(
    'dbo.Orders',
    'IX_Orders_OrderDate'
);
If statistics are genuinely stale or otherwise inadequate, determine the appropriate maintenance action.
Don’t blindly run:
UPDATE STATISTICSagainst every table during a production CPU incident.
The objective is to fix the specific cause, not introduce unnecessary work during an already stressed period.
Step 9: Investigate Parameter-Sensitive Plans
Consider a stored procedure:
CREATE PROCEDURE dbo.GetOrders
    @CustomerID int
AS
BEGIN
    SELECT
        OrderID,
        OrderDate,
        TotalAmount
    FROM dbo.Orders
    WHERE CustomerID = @CustomerID;
END;
Suppose one customer has:
10 rowswhile another has:
5 million rowsA plan that is excellent for one parameter value may not be appropriate for another.
If the procedure suddenly starts consuming significantly more CPU, compare its plans and runtime behavior in Query Store.
Don’t immediately apply OPTION (RECOMPILE) or another hint simply because you suspect parameter sensitivity.
First establish:
- Whether parameter sensitivity actually exists
- Which parameter values are affected
- What plans are being generated/used
- Whether the proposed change improves the workload
Step 10: Investigate Parallelism
Parallelism isn’t automatically a problem.
A large reporting query may legitimately benefit from multiple workers.
Check the configuration:
SELECT
    name,
    value_in_use
FROM sys.configurations
WHERE name IN
(
    'max degree of parallelism',
    'cost threshold for parallelism'
);
Also inspect the execution plan.
Don’t use this simplistic rule:
“CPU is high + parallelism = set MAXDOP to 1.”
That can make some workloads worse.
Investigate the query, execution plan, workload, CPU pressure and wait behavior together.
The cost threshold for parallelism setting is a threshold used during plan selection; it is not a percentage of CPU utilization and should not be treated as a universal value that must be changed simply because CPU is high.
Step 11: Check Wait Statistics
High CPU can sometimes be accompanied by waits such as:
SOS_SCHEDULER_YIELDThis can be an important clue during CPU troubleshooting.
However:
A wait type is evidence, not automatically the root cause.
For example, seeing SOS_SCHEDULER_YIELD doesn’t mean:
“Change this configuration.”
Instead, investigate which workload is producing the CPU pressure and what that workload is doing.
Use wait statistics together with:
- CPU consumption
- Execution plans
- Query Store
- Logical reads
- Workload changes
- Query execution frequency
Step 12: Look for a Workload Increase
Sometimes nothing is wrong with the query.
The workload simply increased.
For example:
January

Orders       = 10 million
CPU/query    = 200 ms
Later:
September

Orders       = 80 million
CPU/query    = 2,000 ms
The query hasn’t changed.
The data and workload have.
This is particularly important for queries performing scans or processing large numbers of rows.
Ask:
Did the query become inefficient, or did the amount of work increase?
Those require different solutions.
A Real-World Production Scenario
Imagine the application team reports:
“The application is slow and the SQL Server CPU is at 97%.”
The first investigation shows:
SQL Server CPU = 97%You check the currently executing requests and find:
Query A
CPU          = 18,500 ms
Elapsed      = 19,200 ms
Logical Reads = 15,000,000
This is immediately interesting.
The query is consuming substantial CPU and performing a large amount of logical work.
You inspect the execution plan and find:
Large Index Scan
       ↓
Filter
       ↓
Hash Match
       ↓
Sort
You then compare the query with its historical Query Store data.
The previous plan was:
Index Seek
    ↓
Nested Loops
    ↓
Key Lookup
and historically the query used around:
150 ms CPUThe current plan is consuming:
4,500+ ms CPUNow you have a much better diagnosis:
The high CPU alert is a symptom. The query plan regression is the likely root cause.
At this point, the investigation should move toward why the plan changed, whether the new plan is genuinely inferior for the current workload, and what remediation is appropriate.
That is much better than simply increasing CPU.
What You Should NOT Do During a High CPU Incident
Avoid these common reactions:
Restart SQL Server without understanding the cause
Clear the entire plan cache
Set MAXDOP = 1 immediately
Rebuild every index Update statistics on every table
Add every missing-index recommendation
Kill every query consuming CPU
Increase server CPU before investigating the workload
Grant sysadmin simply because a support user cannot run a DMV
A production incident is the worst time to make broad, unexplained changes.
What If You Don’t Have the Required Permission?
This is a very common real-world situation.
Suppose you’re a technical support engineer and run:
SELECT *
FROM sys.dm_exec_requests;
but you cannot see the information required to troubleshoot the incident.
Don’t spend 30 minutes trying random permission changes.
Tell your DBA:
“I need the appropriate performance-state permission to investigate the high CPU incident. The CPU spike occurred around 14:20, and the affected application is XYZ.”
If you’re investigating SQL Server 2022 or later, the DBA can evaluate whether VIEW SERVER PERFORMANCE STATE is appropriate for the server-level investigation.
For database-scoped performance information, VIEW DATABASE PERFORMANCE STATE may be appropriate. (Microsoft Learn)
This is much safer than giving broad administrative permissions.
Diagnosis Permission vs Fix Permission
This distinction should always be clear.
| Activity | Typical access requirement |
|---|---|
| Investigate current server requests | Server performance-state access |
| Investigate cached query statistics | Server performance-state access on SQL Server 2022+ |
| Investigate Query Store | Database performance-state access on SQL Server 2022+ |
| View execution plan | Appropriate database permissions and, for some scenarios, SHOWPLAN |
| Create an index | Appropriate permission on the target table/database |
| Update statistics | Appropriate permission on the target object |
| Change server configuration | Appropriate server configuration permission |
| Change database configuration | Appropriate database permission |
The exact permission should always be checked against the SQL Server version and object being accessed rather than copying a permission from an older article.
How Do You Know the Problem Is Fixed?
Don’t stop because:
“CPU is back to 40%.”
Validate the actual workload.
Compare:
- CPU utilization
- Query CPU time
- Query duration
- Logical reads
- Execution count
- Execution plan
- Wait behavior
- Application response time
For example:
Before

CPU/query       = 4,500 ms
Logical reads   = 15 million
Duration        = 5 seconds
After the fix:
CPU/query       = 300 ms
Logical reads   = 800,000
Duration        = 400 ms
That’s much stronger evidence than simply seeing the server CPU percentage fall.
SQL Server High CPU Troubleshooting Flow
High CPU Alert
      ↓
Confirm SQL Server is responsible
      ↓
Is the problem happening now?
      ↓
   Yes ─────────────── No
    ↓                   ↓
dm_exec_requests     Query Store
    ↓                   ↓
Identify CPU-heavy queries
          ↓
Compare CPU vs elapsed time
          ↓
Check logical reads
          ↓
Inspect execution plan
          ↓
Check:
• Plan regression
• Statistics
• Indexes
• SARGability
• Parameter sensitivity
• Parallelism
• Workload growth
          ↓
Identify root cause
          ↓
Apply targeted fix
          ↓
Measure again
          ↓
Validate application performance
Quick Production Checklist
- Before closing a high CPU incident, ask:
- Is SQL Server actually consuming the CPU?
- Is the CPU problem current or historical?
- Which queries are consuming CPU?
- Is CPU high per execution or because of high execution fWhat are the logical reads?
- Is CPU close to elapsed time?
- What is the execution plan doing?Did the execution plan recently change?
- Are cardinality estimates reasonable?
- Are statistics appropriate?
- Is the query SARGparameter-sensitive behavior involved?
- Is parallelism appropriate?
- Did workload or data volume increase?
- Do I have the required permissions?
- Does the person applying the fix have the required permissions?
- Did the fix reduce CPU, reads and execution time?
- Did the application actually recover?
Summary
High CPU should not be treated as a configuration problem by default.
It is usually the beginning of an investigation.
The most useful production mindset is:
Measure → Identify → Compare → Investigate → Fix → Validate
Don’t start with:
“How can I reduce CPU?”
Start with:
“What is consuming the CPU, why is it doing so much work, and what changed?”
That shift in thinking can make the difference between temporarily hiding a production symptom and actually fixing the problem.
The goal of this article is simple:
Identify what is consuming the CPU → collect the right information → understand the likely cause → involve the right person with the required permissions → take the appropriate action.
SQL Server Version & Permission Requirements
This article is intended primarily for SQL Server 2019, SQL Server 2022 and later versions, including the newer SQL Server permission model used by SQL Server 2025. Relevant DMV permissions changed in SQL Server 2022, so older articles that simply recommend VIEW SERVER STATE should not automatically be copied to newer environments. (Microsoft Learn)
For Azure SQL Database, some server-level concepts and permissions differ, so the SQL Server on-premises/SQL VM scripts should not be assumed to behave identically in Azure SQL Database. (Microsoft Learn)
Production Tip
if you don’t have the required permission to investigate or implement a production fix, involve the DBA/database security team rather than requesting excessive privileges. The purpose of troubleshooting guidance is to help you solve the problem safely, not bypass your organization’s security model.
Discover more from Technology with Vivek Johari
Subscribe to get the latest posts sent to your email.

