
Introduction
When a SQL Server query is slow, one of the first things a DBA or developer should check is the execution plan.

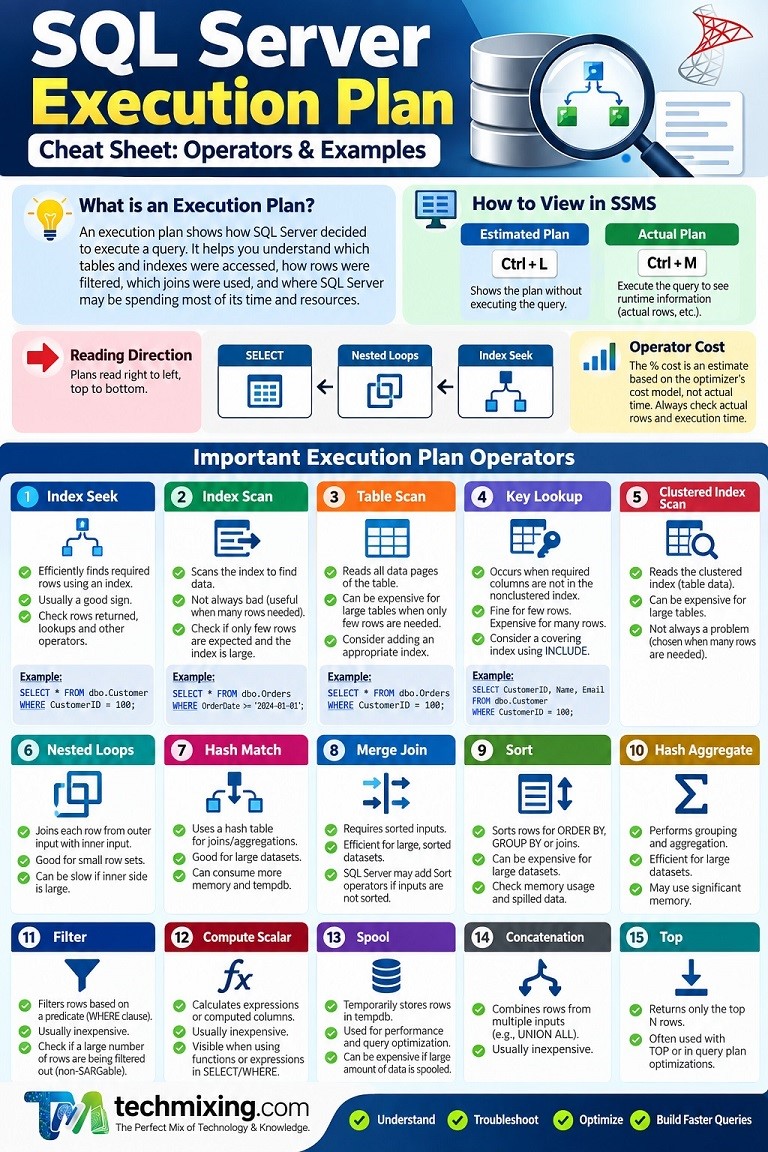
An execution plan shows how SQL Server decided to execute a query. It helps you understand which tables and indexes were accessed, how rows were filtered, which joins were used, and where SQL Server may be spending most of its time and resources.
This SQL Server Execution Plan Cheat Sheet provides a simple reference for understanding the most important execution plan operators and identifying common performance problems.
What Is a SQL Server Execution Plan?
A SQL Server execution plan is a visual or XML representation of the steps SQL Server uses to execute a query.
For example, when you run:
SELECT *
FROM dbo.Employee
WHERE EmployeeID = 100;
SQL Server needs to determine how to find EmployeeID = 100.
It may use:
- An Index Seek
- An Index Scan
- A Table Scan
- A Key Lookup
- Other operators depending on the table structure, indexes and statistics
The execution plan helps you understand what SQL Server actually did, rather than guessing why the query is slow.
How to View an Execution Plan in SSMS
In SQL Server Management Studio (SSMS), you can use:
Estimated Execution Plan
Press:
Ctrl + LThis shows the plan SQL Server expects to use without executing the query.
Actual Execution Plan
Press:
Ctrl + MThen execute the query.
The actual execution plan provides additional runtime information, such as actual rows processed.
Reading Direction & Cost
Plans read right to left, top to bottom. The rightmost operators execute first (usually table/index access), feeding data leftward into joins, filters, and finally the SELECT.
The % cost shown per operator is an estimate, not a measured value. It’s based on the optimizer’s cost model, not actual execution time. So, don’t treat a 90% cost operator as automatically your bottleneck; cross-check with actual rows and actual time.
For performance troubleshooting, the Actual Execution Plan is often very useful because it allows you to compare estimated and actual row counts.
Execution Plan Cheat Sheet: Important Operators
The following operators are among the most important ones to understand when analyzing SQL Server performance.
1. Index Seek
An Index Seek generally means SQL Server can efficiently navigate an index to find the required rows.
Example:
SELECT *
FROM dbo.Customer
WHERE CustomerID = 100;
If CustomerID has a suitable index, SQL Server may use an Index Seek.
Usually: Good
However, an Index Seek does not automatically mean the query is fast. You still need to examine the number of rows returned, lookups, joins and other operators.
2. Index Scan
An Index Scan means SQL Server is scanning the index to find the required data.
A scan isn’t automatically bad.
For example, if a query needs a large percentage of the rows in a table, scanning an index may be more efficient than performing many individual seeks.
Check when:
- A very small number of rows is expected
- The index is large
- The scan reads many pages
- The query is frequently executed
3. Table Scan
A Table Scan means SQL Server reads the table’s data pages to locate the required rows.
This can become expensive when the table is large and the query needs only a small number of rows.
Example:
SELECT *
FROM dbo.Orders
WHERE CustomerID = 100;
If there is no useful index on CustomerID, SQL Server may scan the table.
Potential solution: Consider an appropriate index after analyzing the workload.
4. Key Lookup
A Key Lookup commonly occurs when SQL Server uses a nonclustered index to find rows but needs additional columns that aren’t available in that index.
For example:
SELECT CustomerID, CustomerName, Email, Phone
FROM dbo.Customer
WHERE CustomerID = 100;
SQL Server may seek using an index and then perform Key Lookups to retrieve additional columns.
A small number of lookups may be perfectly acceptable.
A large number of Key Lookups can become expensive.
Possible solution: Consider a covering index using INCLUDE columns when appropriate.
Example:
CREATE INDEX IX_Customer_CustomerID
ON dbo.Customer(CustomerID)
INCLUDE (CustomerName, Email, Phone);
Don’t automatically create a covering index for every lookup. Consider storage, write overhead and overall workload first.
5. Clustered Index Scan
A Clustered Index Scan reads the clustered index.
Because the clustered index contains the table’s data, a clustered index scan can effectively mean reading a large portion of the table.
But again, a scan is not automatically a problem.
If the query needs most of the table’s rows, a scan may be the correct strategy.
6. Nested Loops Join
Nested Loops is commonly useful when one input contains relatively few rows and the other input can be accessed efficiently using an index.
Conceptually:
Small input
    ↓
Nested Loops
    ↓
Seek rows from second input
Nested Loops can become expensive when the outer input contains a large number of rows and the inner operation is repeatedly executed.
Check:
- Number of outer rows
- Number of executions
- Inner access method
- Index availability
- Estimated vs actual rows
7. Hash Match
A Hash Match operator is commonly used for joins and aggregations.
It can be useful when joining larger datasets where suitable indexes aren’t available.
However, Hash Match can consume significant memory.
Watch for:
- Large inputs
- High memory requirements
- Hash warnings
- Spills to tempdb
Don’t assume that every Hash Match needs to be eliminated. SQL Server may have selected it for a valid reason.
8. Merge Join
A Merge Join works efficiently when both inputs are appropriately sorted.
It can be very efficient for larger datasets when the required ordering is already available.
However, additional sorting may increase the cost of the operation.
9. Sort
A Sort operator sorts rows according to a required ordering.
Sorting can consume:
- CPU
- Memory
- Tempdb resources
A Sort isn’t automatically a performance problem.
Check whether:
- A large number of rows is being sorted
- Sorting occurs repeatedly
- An appropriate index could provide the required ordering
- The operation spills to tempdb
10. Stream Aggregate
A Stream Aggregate performs aggregation over an ordered input.
Example:
SELECT CustomerID, COUNT(*)
FROM dbo.Orders
GROUP BY CustomerID;
A Stream Aggregate can be efficient when the input is already appropriately ordered.
11. Hash Match Aggregate
SQL Server can also use Hash Match for aggregation.
This may require additional memory.
If a large dataset is being aggregated, check:
- Input rows
- Memory grant
- Actual execution statistics
- Possible spills
12. Filter
A Filter operator applies a predicate to rows.
For example:
WHERE Status = 'Active'A Filter isn’t necessarily bad.
But if SQL Server reads millions of rows and then filters almost all of them, you should investigate whether a better access path or index could reduce the number of rows processed.
13. Compute Scalar
Compute Scalar calculates expressions or values.
For example:
SELECT Price * Quantity AS TotalAmount
FROM dbo.OrderDetails;
Compute Scalar is usually inexpensive, but complex expressions or repeated calculations can contribute to CPU usage.
14. Parallelism
SQL Server may execute a query using multiple threads.
The execution plan may show operators related to:
- Distribute Streams
- Repartition Streams
- Gather Streams
Parallelism is not automatically bad.
It can improve the performance of expensive queries.
However, excessive parallelism can contribute to CPU pressure and may indicate that a query needs further investigation.
SQL Server Execution Plan Operators – A Quick Troubleshooting Guide
| Operator Name | What that operator shows | Ideal / Best value or case | What to do when it shows an issue |
|---|---|---|---|
| Clustered Index Scan | Reads many/all rows from a clustered index (essentially the whole table). | Good when query needs a large percentage of the table. | If returning only a few rows, check WHERE predicates, indexes, statistics, and SARGability. Consider a suitable nonclustered index. |
| Clustered Index Seek | Uses the clustered index to directly find required rows. | Preferred when the predicate is selective. | Usually good. If many rows are still read, check predicate selectivity and statistics. |
| Index Scan | Reads many/all rows from a nonclustered index. | Acceptable when a large portion of the index is required. | For a small result set, check whether a better index can support the filtering/join. |
| Index Seek | Navigates directly to relevant rows using an index. | Generally preferred for selective queries. | If it reads far more rows than returned, investigate index design, statistics, predicates and residual predicates. |
| Key Lookup | Goes back to the clustered index/heap to retrieve columns not available in the nonclustered index. | Occasional lookup with a small number of rows. | If executed thousands/millions of times, consider a covering index using INCLUDE columns. |
| RID Lookup | Looks up a row in a heap using its Row Identifier (RID). | Small number of lookups. | If expensive/repeated, consider a suitable covering index or evaluate whether the table should have a clustered index. |
| Nested Loops | For each row from the outer input, searches the inner input. | Excellent for small outer input + indexed inner input. | If millions of iterations occur, check indexes and row estimates. Consider Hash/Merge Join where appropriate. |
| Hash Match – Join | Builds a hash table and matches rows between two inputs. | Good for large, unsorted inputs, especially equality joins. | Check memory grant, spills, statistics and indexes. A spill to tempdb is a warning sign. |
| Hash Match – Aggregate | Performs grouping/aggregation using hashing. | Appropriate for large unsorted data. | Check memory grant and spills. Improve filtering/indexing/statistics where possible. |
| Merge Join | Joins two inputs that are ordered on the join columns. | Very efficient when both inputs are already properly sorted/indexed. | If Sort operators are added just for the Merge Join, investigate indexes and whether another join strategy is better. |
| Sort | Sorts rows based on specified columns. | Fine when sorting is genuinely required and data volume is reasonable. | Large/high-cost Sorts may indicate missing indexes. Check for unnecessary ORDER BY, DISTINCT, GROUP BY, or window functions. |
| Missing Index | SQL Server suggests an index that might improve the query. | Treat as a recommendation, not an automatic instruction. | Review workload, existing indexes, write overhead and duplicate indexes before creating it. |
| Filter | Applies a predicate to rows already produced by another operator. | Fine when filtering is necessary and row reduction is expected. | If filtering happens very late or removes most rows, try to push predicates earlier and improve indexing/SARGability. |
| Implicit Conversion | SQL Server converts one data type to another during query processing. | Ideally no unnecessary conversion on indexed/filter/join columns. | Match data types between parameters, variables and columns. Check the warning and whether the conversion affects the index access method. |
| Estimated vs Actual Rows | Compares optimizer’s estimated row count with the rows actually processed. | Close estimates are desirable. | Large differences suggest stale statistics, data skew, parameter sensitivity, non-SARGable predicates or inaccurate cardinality assumptions. |
| Compute Scalar | Calculates expressions, conversions, or derived values. | Usually harmless when inexpensive. | Investigate if CPU cost is high, especially with expensive expressions executed for millions of rows. |
| Table Spool | Temporarily stores rows so they can be reused later. | Reasonable when repeated access genuinely saves work. | If large or repeatedly executed, investigate indexes, join strategy and query structure. |
| Eager Spool | Reads and stores its entire input before continuing. | Appropriate only when materialization is beneficial. | Large Eager Spools can consume memory/tempdb and add I/O. Investigate why SQL Server needs to materialize the data. |
| Lazy Spool | Stores rows as they are requested and reuses them later. | Useful when repeated access occurs. | If repeatedly executed with large data, examine joins, indexes and query structure. |
| Parallelism – Gather Streams | Combines rows from multiple parallel threads into one stream. | Normal at the end of a parallel plan. | Usually not a problem by itself. Investigate if there is severe thread imbalance or excessive parallelism overhead. |
| Parallelism – Distribute Streams | Distributes rows among parallel worker threads. | Normal when parallel processing begins. | Usually fine. Check for skew and whether parallelism actually improves runtime. |
| Parallelism – Repartition Streams | Redistributes rows between threads, usually based on a key. | Normal when parallel operators need data redistributed. | Can be expensive for large data. Check CPU, data skew and whether indexes/query design can reduce the work. |
| Spill | Indicates data did not fit into available memory and was written to tempdb. | No spill is generally preferred. | Investigate memory grant, cardinality estimates, statistics and indexes. Spills can significantly increase tempdb I/O. |
| Memory Grant | Memory requested/reserved for operations such as Sort and Hash Match. | Enough memory to avoid spills, but not excessively large. | Large unused grants can cause concurrency problems. Too-small grants can cause spills. Check estimated rows, statistics and memory grant feedback. |
| Stream Aggregate | Performs grouping/aggregation over an already ordered input. | Excellent when input is already appropriately ordered. | If an expensive Sort is required first, check whether an index can provide the required order. |
| Aggregate / Hash Aggregate | Groups rows and calculates aggregates such as SUM, COUNT, AVG. | Efficient processing with reasonable memory usage. | Check for spills, excessive input rows and unnecessary aggregation. |
| Constant Scan | Generates constant rows/values; often used internally by SQL Server. | Usually normal and inexpensive. | Generally no action required unless it contributes to an unusual plan pattern. |
| Concatenation | Combines results from multiple inputs, commonly used for UNION ALL or OR-related plans. | Efficient when each input is selective. | Check whether unnecessary branches are being processed or whether query predicates can be simplified. |
| Sequence Project | Calculates values that depend on row sequence, commonly window-function processing. | Normal for functions such as ROW_NUMBER(). | Check sorting and input size if it becomes expensive. |
| Window Spool | Stores rows temporarily to support window functions. | Acceptable when required by the window operation. | Large Window Spools can consume memory/tempdb. Check indexing, ordering and window-function design. |
| Assert | Checks a condition that must be true; often appears for constraints or scalar subqueries. | Usually inexpensive and expected when required. | Investigate if it causes an unexpected error or expensive processing. Check constraints/subquery logic. |
| Top | Limits the number of rows returned/processed. | Good when the query genuinely needs only a limited number of rows. | Check ordering and indexes if SQL Server reads many rows just to return a small number. |
| Distinct Sort | Sorts rows and removes duplicates, often caused by DISTINCT. | Appropriate when duplicate removal is genuinely required. | If expensive, determine why duplicates exist. Avoid unnecessary DISTINCT; fix joins/query logic where possible. |
| Parallelism – Repartition Streams | Redistributes rows across threads based on a partitioning key. | Appropriate for balancing parallel work. | Watch for high CPU, skew and large data movement. |
| Bitmap | Creates a bitmap filter to eliminate rows early during parallel/hash processing. | Useful optimization; reduces rows flowing through the plan. | Usually no action required. Investigate only if the overall plan remains expensive. |
| Table Scan | Reads the entire heap table. | Acceptable only when most/all rows are needed or the table is very small. | For selective queries, consider indexes and SARGable predicates. |
| Index Spool | Builds a temporary index on intermediate results for repeated access. | Can be useful for avoiding repeated expensive scans. | Frequent/large Index Spools may indicate missing indexes or an inefficient query strategy. |
| Segment | Divides rows into groups, often for windowing or sequence processing. | Normal when required by the query. | Usually no action unless it contributes significantly to overall cost. |
Execution Plan Warnings You Should Check
Execution plans can display warning indicators.
Pay attention to warnings involving:
Thick arrows
Arrow width is proportional to row count.
Thick arrows indicate a large number of rows flowing between operators. Pay particular attention when the estimated and actual row counts differ significantly.
Warning icons (yellow triangle) on operators
No Join Predicate – Accidental cross join
Type Conversion (CONVERT_IMPLICIT) – Often kills index usage (mismatched data types/collations)
Columns With No Statistics
Missing Index
SQL Server may suggest an index that could improve a particular query.
Treat missing-index recommendations as suggestions, not automatic instructions.
Evaluate:
- Existing indexes
- Query frequency
- Write workload
- Storage
- Similar indexes
before creating anything.
Spill to Tempdb
A spill can occur when an operator doesn’t have enough memory to complete its operation efficiently.
Common operators involved include:
- Sort
- Hash Match
- Hash Aggregate
Spills can affect query performance and should be investigated when significant.
Implicit Conversion
Implicit conversions can prevent efficient index usage in some situations.
Example:
WHERE VARCHARColumn = N'100'when the data types don’t match appropriately.
Check the data types used by:
- Columns
- Variables
- Parameters
- Application code
Cardinality Estimate Problems
SQL Server estimates how many rows an operation will return.
If estimated rows and actual rows are significantly different, the optimizer may choose an inefficient plan.
For example:
Estimated Rows: 10
Actual Rows:    500,000
This difference deserves investigation.
Seek Predicate vs Predicate
Seek Predicate
Conditions SQL Server uses to navigate an index and identify the relevant rows efficiently.
Seek Predicate → helps locate rows
Predicate
A condition SQL Server uses to filter rows after they have been accessed.
Predicate → filters rows
Estimated vs Actual Execution Plan
- Estimated Plan
- Generated without executing
- Shows estimated rows
- Useful before execution
- Ctrl + L
Actual Plan
- Query Generated after query execution
- Shows actual rows
- Useful for troubleshooting
- Ctrl + M
Estimated Rows vs Actual Rows
One of the most useful things to check in an actual execution plan is the difference between:
Estimated Number of Rows
and
Actual Number of Rows
A large difference may indicate issues involving:
- Outdated statistics
- Data distribution
- Parameter sensitivity
- Correlated predicates
- Complex expressions
- Cardinality estimation
Don’t immediately assume statistics are the only problem. Investigate the complete query and data distribution.
Execution Plan Cost Percentage
SSMS displays estimated operator costs as percentages.
For example:
Index Seek       5%
Hash Match      70%
Sort             25%
Many beginners assume the operator with the highest percentage is always the root cause.
That is not necessarily true.
The cost percentage is an optimizer estimate, not actual elapsed time.
Use it as a clue, not as the final answer.
Execution Plan Direction
Execution plans are generally read from the right toward the left.
For example:
Table/Index Access
        ↓
      Join
        ↓
     Filter
        ↓
     SELECT
The data flows toward the SELECT operator.
However, don’t rely only on visually following the arrows. Examine the properties of important operators and compare estimated and actual execution information.
Execution Plan Properties
Right-click an operator and select Properties.
Important properties can include:
- Actual Number of Rows
- Estimated Number of Rows
- Actual Number of Executions
- Estimated Number of Executions
- Estimated I/O Cost
- Estimated CPU Cost
- Seek Predicates
- Predicate
- Object
- Ordered
- Memory-related information
The Properties window often provides more useful information than simply looking at the graphical plan.
Execution Plan Cheat Sheet for Slow Queries
When a query is slow, use this simple checklist.
Step 1: Check the actual execution plan
Look for expensive or suspicious operators.
Step 2: Compare estimated and actual rows
Look for significant estimation differences.
Step 3: Check scans
Determine whether large tables or indexes are being scanned unnecessarily.
Step 4: Check Key Lookups
Determine whether thousands or millions of lookups are occurring.
Step 5: Check joins
Look at:
- Nested Loops
- Hash Match
- Merge Join
and understand why SQL Server selected the join strategy.
Step 6: Check Sort operators
Determine whether large datasets are being sorted.
Step 7: Check warnings
Look for:
- Missing indexes
- Spills
- Implicit conversions
- Cardinality issues
Step 8: Check memory
Investigate memory grants and spills when relevant.
Step 9: Check statistics
Make sure statistics are appropriate and sufficiently current for the workload.
Step 10: Validate the solution
After making a change, compare:
- Execution time
- CPU
- Logical reads
- Physical reads
- Actual execution plan
Don’t assume that a plan that looks better is automatically faster.
Combine Execution Plans with STATISTICS IO and TIME
Execution plans should not be analyzed in isolation.
You can also use:
SET STATISTICS IO ON;
SET STATISTICS TIME ON;

SELECT *
FROM dbo.Orders
WHERE CustomerID = 100;

SET STATISTICS IO OFF;
SET STATISTICS TIME OFF;
STATISTICS IO helps you understand I/O activity.
STATISTICS TIME helps you understand CPU and elapsed time.
This combination gives you stronger evidence when tuning a query.
Combine Execution Plans with Query Store
For production troubleshooting, Query Store is extremely useful.
It can help you identify:
- Frequently executed queries
- High CPU queries
- High-duration queries
- Query regressions
- Plan changes
- Historical performance
A useful troubleshooting workflow is:
Query Store
     ↓
Find Problem Query
     ↓
Open Execution Plan
     ↓
Analyze Operators
     ↓
Check STATISTICS IO/TIME
     ↓
Tune Query or Index
     ↓
Validate Performance
Tools Worth Pairing With This
- Plan XML – right-click → “Show Execution Plan XML” for scripting/automation or diffing plans.
- sys.dm_exec_query_stats / sys.dm_exec_cached_plans – find expensive plans already cached in production.
- Query Store – track plan changes over time and catch plan regressions after a parameter sniffing event.
- SentryOne Plan Explorer (free)-often clearer visualization than SSMS for complex plans.
Common Execution Plan Mistakes
Mistake 1: Assuming every scan is bad
A scan can be the correct choice when a query needs a large percentage of the table.
Mistake 2: Creating every missing index
Missing-index suggestions don’t consider the complete workload.
Mistake 3: Focusing only on cost percentage
Estimated cost percentages don’t represent actual runtime by themselves.
Mistake 4: Ignoring actual row counts
Estimated versus actual rows can provide important clues about plan quality.
Mistake 5: Looking only at the slowest operator
A slow operator may be a consequence of an earlier problem.
Mistake 6: Changing indexes without measuring
Every index has a cost.
Indexes consume storage and can increase the cost of INSERT, UPDATE and DELETE operations.
Mistake 7: Ignoring application parameters
Parameter-related issues can sometimes cause a query to perform differently for different parameter values.
Quick SQL Server Execution Plan Cheat Sheet
| Execution Plan Item | What to Check |
|---|---|
| Index Seek | Is the seek selective and efficient? |
| Index Scan | How many rows/pages are being read? |
| Table Scan | Is a large table being scanned unnecessarily? |
| Key Lookup | Are there excessive lookups? |
| Nested Loops | Is the outer input small enough? |
| Hash Match | Is memory usage or spilling a problem? |
| Merge Join | Are inputs appropriately ordered? |
| Sort | Is a large dataset being sorted? |
| Filter | Are too many rows filtered after being read? |
| Parallelism | Is parallel execution helping or creating pressure? |
| Missing Index | Is the recommendation actually useful for the workload? |
| Implicit Conversion | Are data types mismatched? |
| Spill | Is an operator spilling to tempdb? |
| Estimated vs Actual Rows | Are cardinality estimates accurate? |
| Memory Grant | Is memory sufficient or excessive? |
SQL Server Execution Plan Troubleshooting Checklist
Before changing a query or index, ask:
1. Is the query actually slow?
Measure the duration.
2. Is CPU high?
Check CPU time and workload information.
3. Are logical reads high?
Use STATISTICS IO.
4. Is the execution plan efficient?
Review the actual plan.
5. Are estimated and actual rows very different?
Investigate cardinality estimation.
6. Are there excessive lookups?
Check whether a covering index is appropriate.
7. Are there scans?
Determine whether they are expected or avoidable.
8. Are joins expensive?
Understand the join strategy and number of rows processed.
9. Are there spills?
Investigate memory grants and operators.
10. Did the change actually improve the query?
Measure before and after.
Top 50 Azure SQL Execution Plan Interview Questions and Answers (Beginner to Advanced)
Summary
An execution plan is one of the most powerful tools available to a SQL Server DBA and developer for understanding query performance.
But the goal should not be to make every execution plan look “perfect.”
The goal is to understand why SQL Server selected a particular execution strategy and determine whether that strategy is appropriate for the workload.
A simple production troubleshooting approach is:
Find the query → Capture the actual plan → Check row estimates → Identify expensive operations → Check I/O and CPU → Investigate indexes/statistics → Make one change → Measure again.
This Execution Plan Cheat Sheet can be used as a quick reference whenever you troubleshoot a slow SQL Server query.
Discover more from Technology with Vivek Johari
Subscribe to get the latest posts sent to your email.

