
A practical, execution-plan-first reference for diagnosing and fixing slow queries.
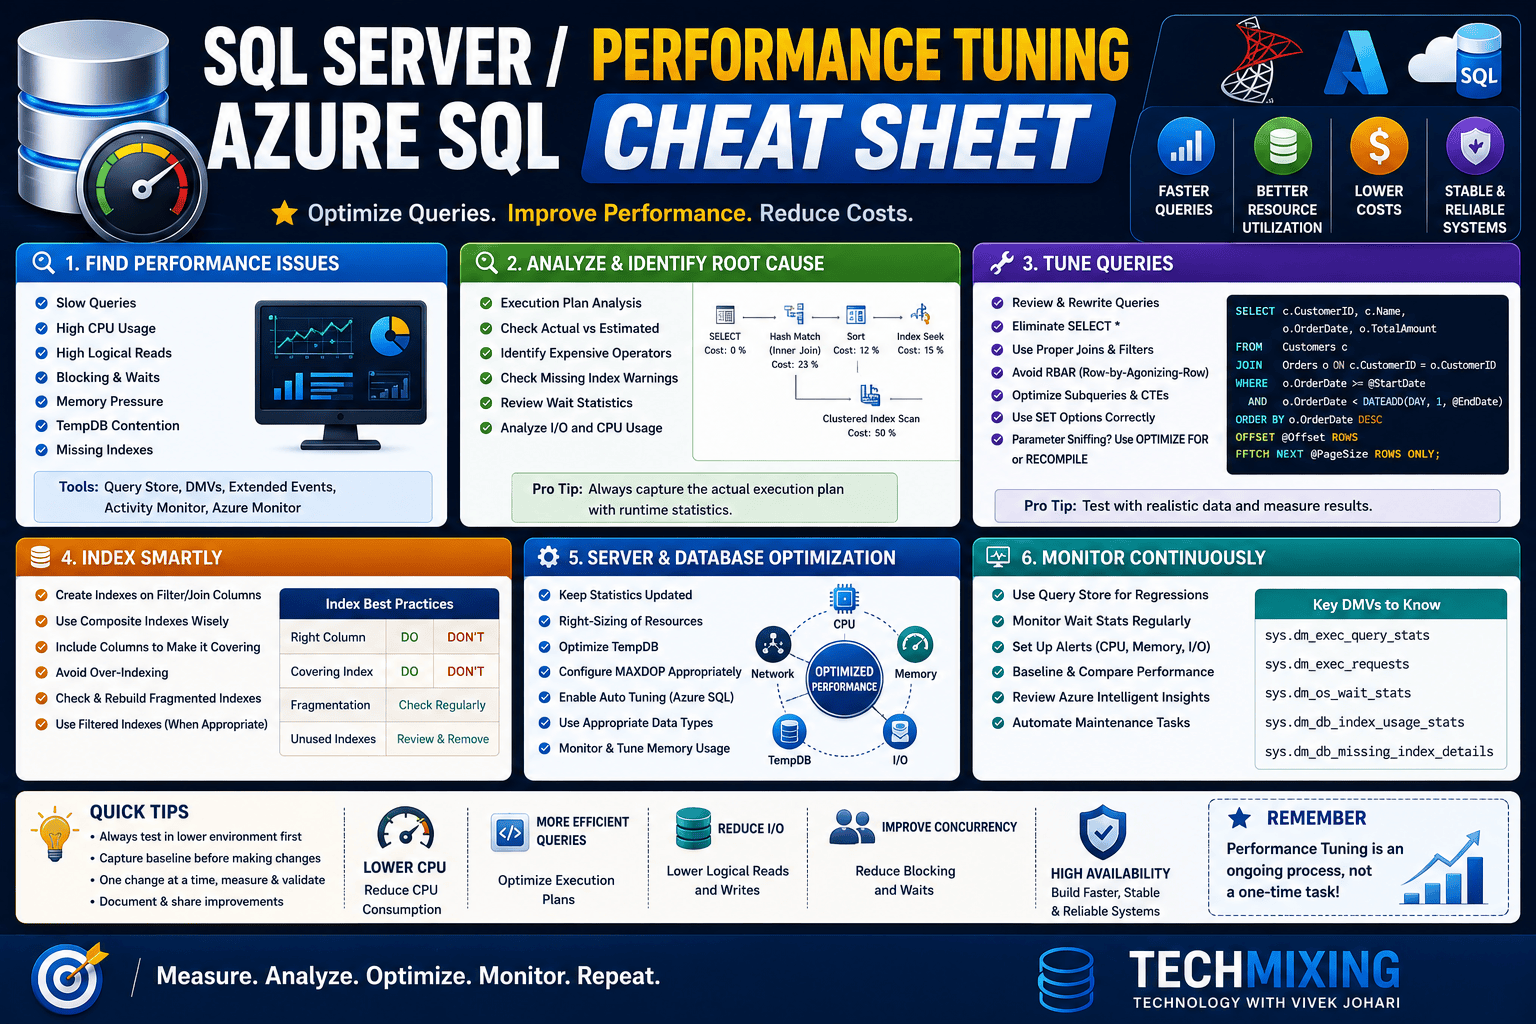
1. The Tuning Workflow (Top-Down)
- Identify the slow query — Query Store,
sys.dm_exec_query_stats, or user report. - Measure baseline —
STATISTICS IO,STATISTICS TIME, actual execution plan. - Read the plan — find the most expensive operator, not just the highest %.
- Classify the problem — bad estimate, missing index, non-SARGable predicate, parameter sniffing, or design issue.
- Fix the smallest thing that works — index tweak before query rewrite before hints.
- Re-measure — confirm logical reads and duration both improved, not just one.
- Validate under load — a fix that helps one execution can hurt others (plan reuse).
2. Baseline Measurement
SET STATISTICS IO ON;
SET STATISTICS TIME ON;
-- run your query
SET STATISTICS IO OFF;
SET STATISTICS TIME OFF;

-- Actual execution plan (always use ACTUAL, not estimated, for tuning)
SET STATISTICS XML ON;
Read logical reads, not just duration. Duration is affected by caching, server load, and network. Logical reads are stable and comparable across runs.

Note:
STATISTICS IOmeasures at the statement level. Query Store measures at the stored-procedure boundary and includes system overhead – the two numbers will legitimately differ for the same execution. Don’t assume a bug when they don’t match.
3. Reading Execution Plans – What to Look For
| Symptom | Likely Meaning |
|---|---|
| Thick arrows | Large row counts flowing between operators |
| Estimated vs Actual rows differ wildly | Bad cardinality estimate — stale stats or non-SARGable predicate |
| Yellow warning triangle | Implicit conversion, missing stats, or spilled data |
| Key Lookup + high execution count | Missing covering index |
| Table Scan / Clustered Index Scan on large table | Missing index or non-SARGable filter |
| Sort operator with high cost | Missing index to support ORDER BY, or excessive row width |
| Hash Match on small tables | Missing index enabling a more efficient join type |
| Nested Loops with huge outer input | Often fine for small sets, disastrous for large ones |
| Parallelism (yellow circle icon) | Check MAXDOP / cost threshold — not always bad |
4. SARGability -The #1 Free Performance Win
Non-SARGable (breaks index seeks):
WHERE YEAR(OrderDate) = 2026
WHERE ISNULL(Status, '') = 'Active'
WHERE CAST(Amount AS VARCHAR) = '100'
WHERE Column LIKE '%searchterm%'
WHERE Amount * 1.1 > 100
SARGable rewrite:
WHERE OrderDate >= '2026-01-01' AND OrderDate < '2027-01-01'
WHERE Status = 'Active'   -- avoid wrapping the column at all
WHERE Amount = 100        -- match data types, don't cast the column
WHERE Column LIKE 'searchterm%'   -- leading wildcard kills seeks
WHERE Amount > 100 / 1.1  -- move the math off the column
Rule: Never apply a function to the column in a WHERE clause. Apply it to the constant/parameter instead.
5. Index Strategy Cheat Sheet
-- Covering index pattern: key columns first, INCLUDE for the rest
CREATE NONCLUSTERED INDEX IX_Orders_CustomerId_OrderDate
ON dbo.Orders (CustomerId, OrderDate)
INCLUDE (OrderTotal, Status);
- Equality columns before range columns in the key (
WHERE CustomerId = @id AND OrderDate > @date→CustomerId, OrderDate). - INCLUDE columns that are only ever selected, never filtered/joined/sorted on — keeps the key narrow.
- Column order matters for the leading-edge seek;
(A, B)doesn’t help a query filtering only onB. - Match index key order to
ORDER BYto avoid a Sort operator. - Avoid over-indexing: every index adds write cost. Check
sys.dm_db_index_usage_statsforuser_seeksvsuser_updatesbefore keeping one. - Filtered indexes for skewed data:
CREATE INDEX ... WHERE Status = 'Active'when most rows are inactive.
6. Statistics
-- Check stats freshness
SELECT s.name, sp.last_updated, sp.rows, sp.modification_counter
FROM sys.stats s
CROSS APPLY sys.dm_db_stats_properties(s.object_id, s.stats_id) sp
WHERE s.object_id = OBJECT_ID('dbo.Orders');

-- Manual update (FULLSCAN for critical tables, sampled for huge ones)
UPDATE STATISTICS dbo.Orders WITH FULLSCAN;
Auto-update triggers around 20% + 500 rows modified by default (lower thresholds available under compat level 130+ with trace flag / DB scoped config). Large tables can go a long time between auto-updates — don’t assume “recent” without checking.
7. Parameter Sniffing
Symptoms: same query, wildly different durations depending on input; plan looks “wrong” for the current parameter but was fine yesterday.
Diagnosis:
-- Compare plans across parameter values in Query Store
SELECT q.query_id, p.plan_id, rs.avg_duration, rs.avg_logical_io_reads
FROM sys.query_store_query q
JOIN sys.query_store_plan p ON q.query_id = p.query_id
JOIN sys.query_store_runtime_stats rs ON p.plan_id = rs.plan_id
WHERE q.query_id = <id>
ORDER BY rs.avg_duration DESC;
Fixes, roughly in order of preference:
OPTION (RECOMPILE)– for genuinely variable, infrequent queries.OPTIMIZE FORa representative value – for skewed-but-known distributions.- Query Store plan forcing (
sp_query_store_force_plan) – pin a known-good plan. - Split into separate procedures for very different parameter shapes.
8. Anti-Patterns to Eliminate
| Anti-Pattern | Why It Hurts | Fix |
|---|---|---|
| Cursors for row-by-row logic | Massive overhead vs set-based ops | Rewrite as a single set-based statement |
SELECT * | Blocks covering indexes, wastes IO/network | Select only needed columns |
Scalar UDFs in WHERE/SELECT | Row-by-row execution, blocks parallelism | Inline logic or use inline TVF; compat 150+ enables auto-inlining |
| Implicit conversions (mismatched types in JOIN/WHERE) | Kills index seeks silently | Match data types explicitly |
| Multi-statement TVFs | Estimated at 1 or 100 rows — bad cardinality | Prefer inline TVFs |
NOLOCK everywhere | Dirty reads, not a performance fix for the real issue | Address blocking at the source |
| Wide clustered index keys | Bloats every nonclustered index | Keep clustered key narrow, static, unique |
9. Blocking & Locking Quick Checks
-- Who is blocking whom
SELECT r.session_id, r.blocking_session_id, r.wait_type, r.wait_time,
       r.wait_resource, t.text
FROM sys.dm_exec_requests r
CROSS APPLY sys.dm_exec_sql_text(r.sql_handle) t
WHERE r.blocking_session_id <> 0;

-- Lock detail
SELECT request_session_id, resource_type, resource_database_id,
       request_mode, request_status
FROM sys.dm_tran_locks;
Reduce lock footprint: shorter transactions, correct isolation level (consider READ COMMITTED SNAPSHOT for read-heavy OLTP), index to avoid scans that lock more rows than necessary.
10. Before/After Validation Template
Use this every time you tune something – it’s the difference between “feels faster” and proof:
| Metric | Before | After |
|---|---|---|
| Logical reads | ||
| Duration (avg, warm cache) | ||
| CPU time | ||
| Execution plan shape | Scan / Lookup / Sort? | Seek / covered / no sort? |
| Estimated vs actual rows |
Real example: a booking-lookup procedure went from 50+ seconds to under 3 seconds across three steps -cursor removal, SARGability fixes, then a covering index — with total logical reads down roughly 83%. Each step was measured independently before moving to the next.
11. Quick MAXDOP / Cost Threshold Sanity Check
SELECT name, value_in_use FROM sys.configurations
WHERE name IN ('max degree of parallelism', 'cost threshold for parallelism');
Default cost threshold of 5 is very low for modern hardware – many shops raise it to 25–50 to stop small queries from going parallel unnecessarily. (Azure SQL DB manages MAXDOP automatically per resource tier; MI and IaaS SQL Server need manual tuning.)
Discover more from Technology with Vivek Johari
Subscribe to get the latest posts sent to your email.

